Home Beginner's Corner Score the Perfect Fishing Spot: A Data-Backed Method

Score the Perfect Fishing Spot: A Data-Backed Method

0
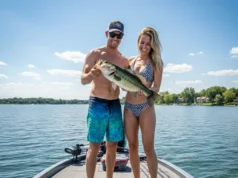
A young couple on a fishing boat, where the woman in a bikini is reeling in a fish and the man is ready with a net.

The sun rises, casting a glare across a seemingly endless, featureless lake. For many anglers fishing, this view is a gamble—a hope that fish are somewhere below. But for a prepared angler, that opaque surface is a blueprint waiting to be read. This guide transforms that gamble into a science, providing a systematic, data-backed method to deconstruct any aquatic ecosystem and pinpoint the exact fishing hot spots.

This isn’t about secret fishing spots or lucky lures. It’s about a fundamental shift in perspective based on understanding fish behavior. You’ll begin by viewing a body of water as a vast, intimidating unknown, but you will finish with a clear, repeatable methodology that empowers you to deconstruct any lake, river, or pond into a predictable map of high-probability fishing locations.

To get there, we’ll decode the underwater landscape by understanding the foundational pillars of habitat and interpreting maps that reveal the world beneath the surface. We’ll learn to “think like a fish” by mastering the biological drivers—especially water temperature—that dictate where a target species like Largemouth Bass, Lake Trout, or Walleye must be at any given time of year. We’ll see how modern tools like a fishfinder and GPS work in tandem with the timeless skill of “reading the water” to verify our hypotheses with precision. Finally, we’ll execute the method: a repeatable, three-phase process that systematically narrows the search from a whole lake down to a single, productive cast.

How Do You Decode the Underwater Landscape?

A close-up of a modern fish finder screen showing a detailed bathymetric map and side-imaging sonar returns of underwater structure.

Before we can find fish, we have to understand the world they live in. It’s a three-dimensional environment governed by a complex set of rules. Learning these rules allows you to stop guessing and start predicting. This is the foundation upon which all successful fishing is built.

What Are the Four Pillars of Fish Habitat?

Every creature, whether it walks on land or swims in the water, has the same basic needs. For fish, we can break this down into four foundational pillars. As explained by university extension programs define habitat, understanding these pillars is the first step in translating ecology into a practical search strategy to find the right fishing spot.

The first, and most obvious, is Food. The entire aquatic biomass begins with sunlight and nutrients. These feed the microscopic phytoplankton and zooplankton, which in turn feed baitfish and invertebrates. Game fish species are simply following their stomachs, so your primary job is to find the areas that concentrate this forage.

Second is Water. This is more than just the medium fish swim in; it’s about water quality. Key parameters like dissolved oxygen levels, temperature, and pH create zones of comfort and stress. A beautiful-looking spot with low DO is an underwater desert, incapable of supporting the life you’re looking for.

Third, we have the critical duo of Shelter and Cover. These two terms are distinct. Structure refers to the physical contour of the bottom—features like points, drop-offs, and humps. Cover refers to physical objects on that structure, such as weed beds, lily pads, submerged logs, overhanging trees, rock piles, and docks. Structure attracts bait, and cover is often where predators will stop to rest, ambush prey, and feel safe.

The final pillar is Space. Fish need adequate room to carry out all their life functions, from foraging and migrating between seasonal habitats to accessing specific spawning areas in shallow coves or tributary streams. This pillar reminds us that a fish’s needs change throughout the year, requiring different habitat types to meet those needs.

The best fishing spots are rarely defined by one pillar alone; they are a result of the Interplay of Pillars. A submerged hump (structure) is good, but it becomes a hot spot only when it holds baitfish (food) at a comfortable temperature and oxygen level (water) and has a few boulders on top for ambush points (cover). This concept is formalized in the federal designation of Essential Fish Habitat (EFH), which legally identifies the most critical areas for fish. Within EFH, certain locations are designated as Habitat Areas of Particular Concern (HAPC)—the “best of the best” zones that are rare or ecologically vital. Using tools like NOAA’s EFH Mapper, you can identify these scientifically-vetted hotspots before you even leave the house.

Pro-Tip: Use the four pillars as a mental checklist every time you approach a new spot. Ask yourself: Does it offer food? Is the water quality right? Is there shelter or cover? Does it fit the species’ spatial needs for the season? If you get a “no” on any of these, it’s a low-percentage spot, and it’s time to move on.

Understanding what fish need is the first step; applying that knowledge to a largemouth bass’s specific habitat needs is how you start catching them consistently. The next step is learning to “see” these elements on a map before you ever launch the boat.

How Do You Read an Underwater Map?

An underwater map, or bathymetric map, is the single most powerful tool for an angler. It’s the blueprint that reveals the hidden world below. According to the National Ocean Service, NOAA defines bathymetry as the underwater equivalent of topography—it’s the study and mapping of the depths and shapes of the lakebed.

The language of these maps is written in contours, or isobaths. Each line connects points of equal depth. The spacing of these lines tells you everything you need to know about the slope. Tightly packed lines indicate a steep drop, a bluff, or a ledge. Widely spaced lines show a gradual, sloping flat. By recognizing patterns in these lines, you can identify the primary structures that attract fish:

  • Points: Contour lines that bow out and away from the shoreline, indicating a finger of land extending into the water.
  • Humps/Reefs: Enclosed circles or ovals offshore, representing underwater islands.
  • Holes: Enclosed circles where the depth increases, indicating a depression or deep hole.
  • Saddles: A dip in the elevation between two humps or points.
  • Channels and Ledges: Old river or creek channels in reservoirs appear as winding depressions with tight contours, while ledges are sudden, sharp packings of contour lines.

It’s crucial to remember the distinction between structure and cover. The point is the structure; the fallen tree on the point is the cover. The combination is what creates a five-star hotel for game fish. This is because structure isn’t random; it predictably influences the environment. A point deflects current, creating a feeding lane. A shallow flat near an inlet warms quickly in the spring, making it a prime spawning area. By combining this map analysis with your biological knowledge, you can predict not just where fish might be, but what they will be doing. Modern digital maps from services like Navionics or Humminbird LakeMaster take this to the next level, overlaying this bathymetric data on a GPS grid that allows for pinpoint navigation.

While a topographic map reveals the two-dimensional layout of the bottom, fish live in a three-dimensional world defined by the water itself.

Why Does the Water Column Change With the Seasons?

In many lakes, the water isn’t uniform from top to bottom. It changes dramatically with the season, creating distinct temperature breaks that act as invisible walls, concentrating fish into predictable zones.

In the summer, solar radiation heats the surface water, which becomes less dense and floats on the colder, denser water below. This process is called Thermal Stratification, and it creates three distinct layers. At the top is the Epilimnion, a warm, oxygen-rich layer. At the bottom is the Hypolimnion, a cold, dense layer that is often poor in oxygen due to decomposition. In between is the Metalimnion, the transition zone where the temperature drops rapidly. The plane within this middle layer where the temperature change is most drastic is called the Thermocline.

This stratification doesn’t last forever. In the fall, as the surface water cools, it becomes denser and sinks. This process continues until the entire lake reaches a uniform temperature, allowing wind to mix the lake from top to bottom. This Seasonal Lake Turnover is a vital event that replenishes oxygen in the deep water. A similar, though often less dramatic, turnover happens in the spring after ice-out, as explained by Wisconsin’s Center for Limnology explains spring turnover.

For much of the summer, the thermocline defines the usable habitat for many species. The epilimnion may be too warm, while the hypolimnion may be anoxic (lacking oxygen). This creates a “squeeze” effect, confining fish to the narrow band of the thermocline that offers the best compromise of cool temperature and sufficient oxygen. This knowledge is transformative. By finding the thermocline’s depth with your sonar, you can eliminate vast, unproductive sections of the lake. Your search strategy then becomes laser-focused: find where your preferred structure—a point, a hump, a weedline—intersects with this critical thermocline depth. That intersection is the highest-probability location for active fish in the summer. Understanding how walleye relate to the thermocline is a perfect example of putting this science into action.

Now that we have a three-dimensional map of the environment, we can overlay the final, most important layer: the predictable behavior of the fish themselves.

What Drives a Fish’s Behavior and Location?

An underwater view of a largemouth bass positioned next to a submerged log in clear water.

We’ve moved from general ecology to the specific map of a lake. Now, we dive into the specific biology of our target. A fish’s behavior is not random; it is a predictable response to its core needs, and the most important of these is its preferred water temperature.

How Does Water Temperature Control Fish Activity?

Fish are “cold-blooded,” or ectothermic. This means their internal body temperature and metabolic rate are governed by the temperature of their surrounding environment. This is the master rule that dictates where fish will be and how active they will be. Biologists use three broad thermal classifications:

  • Coldwater fish, like Trout and Salmon, thrive in colder temperatures.
  • Coolwater fish, like Walleye, Pike, and Muskie, prefer a moderate temperature range.
  • Warmwater fish, like Bass, Bluegill, Crappie, and Catfish, are most active in warm water.

There is a direct relationship between temperature and metabolism. As the water warms toward a fish’s optimal range, its metabolism speeds up, forcing it to feed more actively and aggressively. Conversely, as temperatures fall, its metabolism slows, activity is reduced, and feeding habits change to shorter windows. This is backed by extensive scientific study, like this USDA research on salmonid behavior and water temperature.

This principle is so powerful that Temperature Overrides Structure. A fish’s species preference for a certain temperature range is a biological necessity, not a casual preference. Fish will readily abandon what appears to be perfect structure and cover if the temperature moves outside their optimal zone. Imagine finding a perfect-looking log pile in shallow water in mid-summer. The surface temp is 88°F. If you’re hunting for walleye, a coolwater species, they metabolically cannot be there. You must form a new hypothesis and search for similar structure at a deeper, cooler water depth. This knowledge allows you to eliminate vast sections of a lake with a single temperature reading, making it the most powerful filtering tool you have. Connecting this general principle to the specifics of a largemouth bass’s optimal temperature range is how you start to build a seasonal playbook.

Understanding this master rule allows us to build predictable seasonal playbooks for specific species, starting with America’s most popular game fish.

What Seasonal Patterns Do Warmwater Species Follow?

Let’s use the Largemouth Bass (Micropterus salmoides) as our primary example. As a warmwater species, its life is a predictable cycle of movement dictated by the seasons. The Texas Parks and Wildlife data on Largemouth Bass provides an excellent, scientifically-vetted overview of this cycle.

In the spring, as water temperatures rise into the 55-70°F range, bass execute their most significant annual migration. They move from deep water wintering areas toward shallow flats and protected coves to spawn, seeking out hard bottoms of sand or gravel.

In the heat of summer, bass seek thermal refuge. They’ll either move to deeper, cooler water along structures like points and ledges, or they will tuck into dense, shaded cover like thick weed beds or under docks. Their primary feeding movements into the shallows will occur during the early morning and late afternoon when temperatures are cooler.

As the water cools in the fall, bass become highly active. They follow schools of baitfish that are also moving back toward shallow and mid-depth areas. This is a period of aggressive gorging to build reserves for winter.

Finally, in winter, bass return to deeper, more thermally stable water. They relate to vertical structures like bluff banks and channel edges where they can move up or down to find comfortable water with minimal effort. This entire cycle is anchored by the spawn, which is triggered by sustained water temperatures between 55°F and 70°F. An angler in late spring should therefore ignore deep offshore humps and focus exclusively on finding protected shallow coves with hard-bottom areas adjacent to deep-water escape routes.

Understanding where to find them is half the battle; the other half is choosing the best lures for largemouth bass to use when you get there. In contrast, coldwater and coolwater species follow a timeline that is often the mirror opposite of their warmwater cousins.

What Seasonal Patterns Do Coldwater & Coolwater Species Follow?

To understand this contrast, let’s look at Lake Trout (Salvelinus namaycush) as our coldwater example and Walleye (Sander vitreus) as our coolwater example. Their species-specific behavior is a completely different game. The U.S. Fish & Wildlife Service Lake Trout profile is the definitive source for this species’ biology.

For a coldwater species like Lake Trout, the spring and fall are the only times they are found shallow. Immediately after ice-out and just before their fall spawn, when surface temps are in their preferred 45-55°F range, they move into shallow areas. As the surface warms in summer, they are forced into a deepwater retreat, often suspending 100 feet down or more, right at or just below the thermocline to find that perfect balance of cold water and sufficient oxygen.

Walleye location is driven by two factors: their coolwater temperature preference (55-70°F) and an extreme sensitivity to light. Their task is to find the intersection of the right temperature and low light. This leads to strong daily migrations: on bright days, they retreat to deep water or heavy cover, and during low-light periods, they move shallow to feed. Spawning requires specific conditions, often involving migrations up rivers with good current and flow over clean, rocky shoals.

This comparative analysis is a powerful tool. An angler on a lake in late spring with 58°F water knows bass are spawning shallow, walleye have finished spawning and are moving deeper, and lake trout have already retreated to the depths for the summer.

Comparative Analysis of Key Freshwater Game Fish Behavior

Spawning Behavior

Spawning Temp Range: 55-70 °F
Typical Spawning Depth: 2-8 ft
Preferred Substrate: Hard bottom (sand, gravel)

Seasonal Patterns

Spring: Shallow flats/coves.
Summer: Deep water or heavy cover.
Fall: Follows bait shallow.
Winter: Deep, stable water.

Spawning Behavior

Spawning Temp Range: 50-54 °F
Typical Spawning Depth: 6-10 ft (2-3 m)
Preferred Substrate: Rocky shoals, boulders, gravel

Seasonal Patterns

Spring/Fall: Shallow.
Summer: Deep (thermocline).
Winter: Deep.

Spawning Behavior

Spawning Temp Range: 42-50 °F
Typical Spawning Depth: 1-6 ft
Preferred Substrate: Rock, rubble, gravel

Seasonal Patterns

Daily: Deep/cover in bright light, shallow in low light.
Seasonal: Follows typical coolwater patterns but always dictated by light levels.

This ecological and biological knowledge provides the “why” and “where.” Now, we need the tools to verify these theories in real time and connect them to the right presentation, which is where something like The Trout Lure Matrix comes into play.

Which Tools Translate Theory into On-the-Water Action?

A full-body shot of a young man at the helm of a fishing boat, pointing to a GPS map on his fish finder screen.

Knowing where a fish should be is one thing. Confirming it is another. This is where we bridge the gap between pre-trip planning and on-the-water execution, using modern technology to see into the depths and traditional observation to read the surface.

How Does Sonar Reveal What’s Beneath the Boat?

A modern fishfinder gives us eyes underwater. Traditional 2D sonar sends a cone-shaped sound pulse down, displaying the return signal chronologically on a screen that scrolls from right to left. The far right of the screen is what’s happening under the boat right now. According to NOAA’s explanation of how sonar works, this technology is the foundation of underwater mapping.

A fish moving through that cone creates an “arch” shape. The thickness of the arch indicates the fish’s size, while its length indicates the time it spent in the cone. The strength of the return signal also reveals bottom hardness: a thick, bright yellow line indicates rock, while a thin, dim blue line means soft mud. More advanced technologies like Down and Side Imaging provide photo-like detail. Down Imaging gives you a clear vertical picture, perfect for dissecting a specific piece of cover. Side Imaging is a wide, top-down view used for quickly scanning large areas to find isolated structure.

An infographic displayed on a fishfinder screen inside a boat, comparing three sonar views of a submerged tree: 2D CHIRP shows a blobby arch, Down Imaging shows a clear tree shape, and Side Imaging shows the tree casting a long shadow.

Sonar is best used not as a random “fish finder,” but as a verification tool. Use Side Imaging to scan the point from your map study. If it shows the rock composition you predicted, switch to 2D sonar to find the thermocline and look for the arches of game fish at the correct depth. This systematic workflow validates your hypothesis before you ever make a cast.

Pro-Tip: Turn off the “Fish ID” or “fish icon” feature on your sonar unit. It is notoriously inaccurate and often misrepresents things like vegetation or bubbles as fish. Learning to interpret the raw sonar arches will make you a far more effective angler in the long run.

Sonar gives you the “eyes,” but after you’ve made your decision, choosing the right fish finder for your specific needs is the next practical step.

How Do GPS and Digital Maps Create Precision?

If sonar provides the eyes, the Global Positioning System (GPS) provides the memory and the legs. For an angler, the primary function of GPS, as explained by the the official U.S. government information system on GPS, is to mark waypoints—the exact coordinates of a productive spot.

This allows for perfect repeatability. You can return to a tiny offshore rockpile, no bigger than a car hood, with pinpoint accuracy, day after day. Modern chartplotters integrate GPS with high-definition digital lake maps, overlaying your boat’s real-time position onto the detailed bathymetric or topographic map. This allows you to navigate directly to the inside turn on a channel bend that you identified during your pre-trip map study. Mobile fishing apps like onX Fish or Fishbrain bring this power to your smartphone, often supplemented with crowdsourced reports from fishing forums.

This technology transforms angling into a science of precision. By dropping a waypoint for every catch and adding notes, you build a rich personal database. Over time, analyzing this data can reveal powerful patterns that would otherwise be invisible. You might discover that a specific cluster of humps is only productive in the fall on a northwest wind. This is where past data truly informs future success, an advantage amplified by innovations like modern trolling motors with GPS anchoring.

How Can You “Read the Water” Without Electronics?

While technology is a powerful multiplier, it should never replace the essential analog skill of “reading the water.” This is the art of deducing subsurface conditions from surface phenomena, a critical skill for every angler, especially from the bank.

In still water like lakes and ponds, look for visible irregularities. The edges of weed beds or lily pads are natural ambush points. Visible structure like docks, rock piles, and points of land are obvious starting points. And always watch for wildlife—especially birds diving, which indicates surface activity and nervous water where bait fish are being pushed.

In rivers and streams, the current is king. According to the New York’s DEC guide to fishing rivers and streams, fish must balance conserving energy with accessing food. They will rarely hold in the fastest water. Instead, look for current breaks (behind a large rock), eddies (calm water on the inside of a bend), pools, and seams (the visible line where fast and slow water meet). Undercut banks are prime sanctuaries for the largest fish. An experienced angler doesn’t just see a line of bubbles; they see a predictable feeding lane. This skill remains essential, providing the data for a perfect cast even in a technologically advanced era. Following a step-by-step system for reading a river is the best way to master this timeless art.

With a firm grasp of the environment, the fish, and the tools, we can now synthesize everything into a single, repeatable methodology.

What is the Systematic Process for Finding Fish?

A full-body shot of a young woman in a bikini on a boat, intently studying a fish finder screen while holding a fishing rod.

This is where it all comes together. The following proactive, data-driven, and repeatable three-phase methodology will work on any body of water, for any species, at any time of year.

Phase 1: How Do You Create a Pre-Trip Game Plan?

The most productive fishing trip begins long before you reach the water. This is the digital scouting phase where you do your homework.

  1. Map Study: Use bathymetric and topographic maps, either through dedicated software, Google Earth, or fishing apps, to conduct a thorough analysis. Identify high-probability structures like points, humps, flats, and channel bends.
  2. Seasonal Appropriateness: Research the season and cross-reference those structures with your target species’ known seasonal behaviors. For early spring bass, you should focus on points and drop-offs in north-facing coves with shallow flats adjacent to deep water.
  3. Data Mining: Consult state agency resources like the Idaho Fish and Game’s Fishing Planner tool for stocking reports. Supplement this with anecdotal information when you check online on fishing forums and ask locals at the local bait shop.
  4. Logistics and Regulations: Use satellite imagery to identify access points. Critically, always conclude this phase by checking local regulations and understanding state fishing regulations for the water body, including seasons, permits, and catch rates.

Based on this comprehensive review, you will formulate a clear, testable hypothesis. For example: “Given that it is early summer and water temperatures are approaching 75°F, I predict that Walleye will have moved off their shallow spawning areas and will be located on the first major channel drop-off, at a depth of 15-25 feet, particularly on points with hard-bottom substrate.”

With a clear hypothesis in hand, the goal upon arrival at the water is not to start fishing, but to start investigating.

Phase 2: How Do You Systematically Search a Location?

Upon arrival, your first priority is to scope out the location and verify the key environmental variables of your hypothesis. Use your boat’s electronics to get a precise surface water temperature reading, which you can cross-reference with real-time sources like USGS data on water temperature. Next, idle over deeper water and use 2D sonar to find the exact depth of the thermocline. If these data points differ significantly from your assumptions, your hypothesis needs immediate revision.

Next, execute the search. Navigate to the primary area from your map study and begin investigating with Side Imaging sonar. By driving parallel to the structure, you can scan a wide swath of water, rapidly confirming its composition (rock vs. mud), locating key pieces of cover, and spotting schools of baitfish—all without driving over the fish and spooking them. This systematic search, much like employing systematic grid searches when trolling, quickly confirms if the area has the right ingredients before you ever make a cast.

Phase 3: How Do You Pinpoint the “Spot on the Spot”?

Once your systematic search has confirmed a promising area, the focus shifts from a macro-level investigation to a micro-level analysis to find the hot spot. Slow down and dissect the area with vertical-looking sonar (2D and Down Imaging). Use Down Imaging to get a clear, photo-like image of the cover. Use 2D CHIRP sonar to identify bottom hardness transitions and look for the characteristic arches of game fish.

The goal is to find the unique feature on the larger structure that concentrates fish—a single large boulder on a point, a sharp inside turn on a channel ledge, or the thickest part of a weed bed. This is the “spot on the spot.” A successful data-backed approach culminates here, in identifying a location that checks all the boxes on a simple checklist, which can be turned into a Fishing Spot Scorecard. This quantitative rating system helps you systematically evaluate and select potential spots.

The perfect spot will have:

  1. The correct structure for the season.
  2. The presence of beneficial cover.
  3. The correct temperature zone and oxygen.
  4. The visible presence of forage (baitfish).
  5. The visible presence of target game fish.

Master Your Spot Selection: The Fishing Spot Scorecard

Stop guessing and start analyzing! Our interactive Fishing Spot Scorecard helps you objectively rate potential fishing locations based on critical factors like structure, cover, temperature, forage, and target fish presence. Use this printable tool to improve your pre-trip planning and on-the-water success.

Fishing is dynamic, and hypotheses will often prove incorrect. If a location fails, this methodology provides a logical framework for Advanced Troubleshooting and adaptation. Review the collected data and form a new hypothesis. For example: “The primary point showed no fish. My sonar confirms the thermocline is at 30 feet, and the water temperature there is 68°F. My secondary hypothesis is that the Walleye are not relating to structure but are suspended over the main basin at 30 feet, following schools of open-water baitfish.” This systematic problem-solving, validated by how biologists conduct Kentucky Department of Fish & Wildlife assessments, is what separates consistent success from luck. This iterative cycle of research, hypothesis, and investigation is the engine of consistent angling success, which all comes down to that final moment of execution when you learn how to set the hook.

Conclusion

Locating fish consistently is a science of prediction. It’s built on a hierarchical understanding of the aquatic world, from foundational habitat needs to species-specific behavior. By interpreting bathymetric maps and understanding the vertical dynamics of the water column, you can create a three-dimensional mental model of any lake or river. Temperature is the master variable, and overlaying a species’ thermal preference onto your environmental map is the single most powerful predictive tool you have. Modern sonar and GPS are the remote sensing tools you use to turn a pre-trip hypothesis into a high-confidence action plan.

Master these principles, and you’ll transform every fishing trip into a data-driven decision. Explore our complete library of species and technique guides to continue building your angling knowledge.

Frequently Asked Questions about Choosing a Fishing Spot

What is the best spot to fish in a lake?

The best spots are typically areas of transition, such as points extending into the water, drop-offs near flats, or the edges of weed beds. These locations concentrate baitfish and offer predators an ambush advantage, making them consistently more productive than large, featureless areas.

How can I find fish in a river?

In a river, look for areas where fish can escape the main current while still having easy access to food, such as behind large rocks, in calmer eddies, or along the visible “seam” between fast and slow water. Fish must conserve energy, so they will almost always be in these current breaks rather than the fastest part of the flow.

What is the difference between “structure” and “cover”?

“Structure” refers to the physical shape and contour of the lake or river bottom, such as a drop-off, hump, or point. “Cover” refers to physical objects on the bottom, like a fallen tree, a weed bed, a rock pile, or a boat dock. The very best spots often have good cover on a key piece of structure.

What is the best time of day to fish?

The low-light periods of early morning and late evening are often the most productive times, as many game fish are more active and feed more aggressively under these conditions. This is especially true in the summer when shallower water is cooler during these times, and on heavily overcast days, which can extend the “low-light” bite.

Risk Disclaimer: Fishing, boating, and all related outdoor activities involve inherent risks that can lead to injury. The information provided on Master Fishing Mag is for educational and informational purposes only. While we strive for accuracy, the information, techniques, and advice on gear and safety are not a substitute for your own best judgment, local knowledge, and adherence to official regulations. Fishing regulations, including seasons, size limits, and species restrictions, change frequently and vary by location. Always consult the latest official regulations from your local fish and wildlife agency before heading out. Proper handling of hooks, knives, and other sharp equipment is essential for safety. Furthermore, be aware of local fish consumption advisories. By using this website, you agree that you are solely responsible for your own safety and for complying with all applicable laws. Any reliance you place on our content is strictly at your own risk. Master Fishing Mag and its authors will not be held liable for any injury, damage, or loss sustained in connection with the use of the information herein.

Affiliate Disclosure: We are a participant in the Amazon Services LLC Associates Program, an affiliate advertising program designed to provide a means for us to earn advertising fees by advertising and linking to Amazon.com. As an Amazon Associate, we earn from qualifying purchases. We also participate in other affiliate programs and may receive a commission on products purchased through our links, at no extra cost to you. Additional terms are found in the terms of service.